
Today, almost every web application uses charts to visualize data and try to provide useful and meaning full information along with a user-friendly interface. There are myriad of JavaScript chart and graph libraries out there that have support for many features: interactivity, multiple chart types, responsiveness and much more. We have amassed a list of best JavaScript Chart Libraries to Try in 2020, these libraries will help you to create interactive charts easily.
Most of them are free for personal and commercial use and you can use them according to your needs to crate and visualize your data in the form of charts and graphs.
Read Also —
30 Best jQuery Map Plugins for Your Next Project
10 Best JavaScript Touch Gesture Libraries
20 JavaScript Libraries for Creating Beautiful Scrolling Effects
1. D3.js
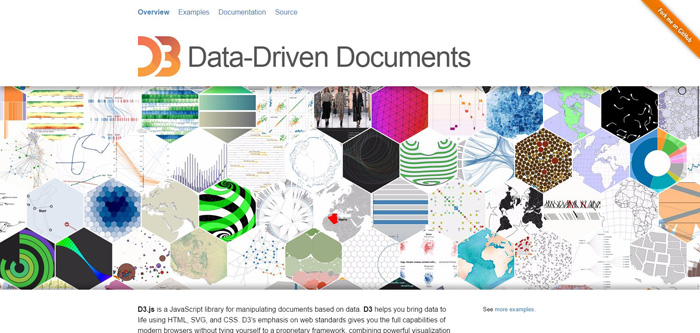
This is one of the most popular and widely used JavaScript library for manipulating documents based on data. D3 helps you bring data to life using HTML, SVG and CSS. D3’s emphasis on web standards gives you the full capabilities of modern browsers without tying yourself to a proprietary framework, combining powerful visualization components and a data-driven approach to DOM manipulation.
Demo & Download
2. Cesium
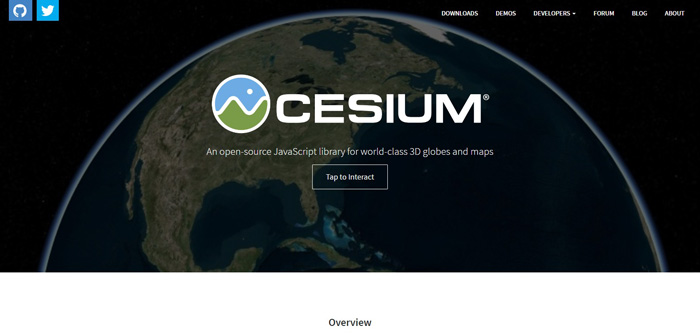
WebGL based JavaScript library for creating high-resolution 3D globes and 2D maps. It supports different map providers, weather simulations, and a ton of other complex features. Their Demos page has a big collection of community projects showcasing what Cesium is capable of, including a 3D map of all the building in New York and projects by NASA.
Demo & Download
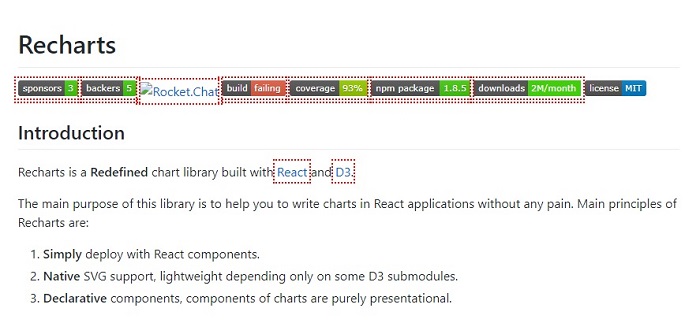
3. Recharts
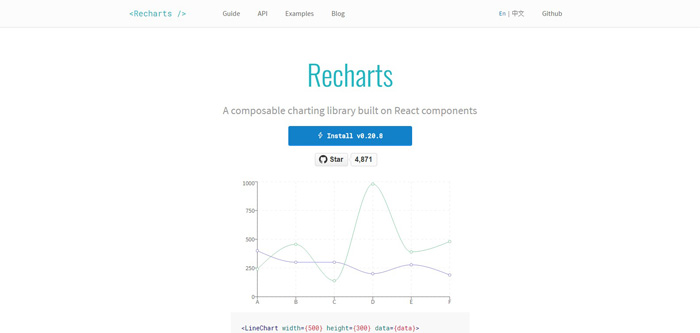
Recharts is a Redefined chart library built with React and D3. The main purpose of this library is to help you to write charts in React applications without any pain. The library also offers a rich examples catalog with more than 50 ready-to-use components, including various Line, Bar, Pie and other types of charts.
Demo & Download
4. G9.js
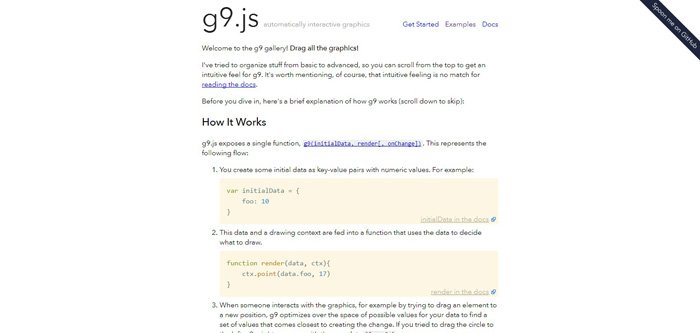
g9 is a javascript library for creating automatically interactive graphics. With g9, interactive visualization is as easy as visualization that isn’t. Just write a function which draws shapes based on data, and g9 will automatically figure out how to manipulate that data when you drag the shapes around.
Demo & Download
5. GraphicsJS
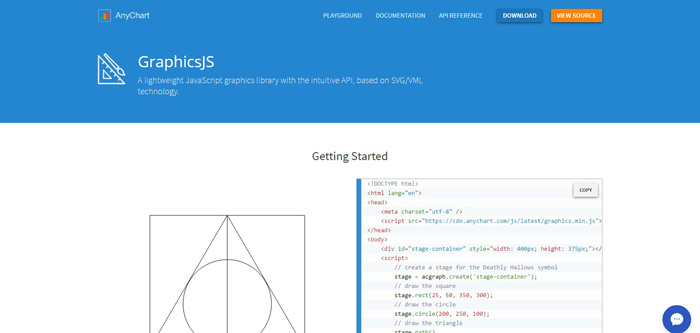
GraphicsJS is a lightweight JavaScript graphics library with the intuitive API, based on SVG/VML technology. You can control text wrap, text overflow, text indent, line height, letter spacing, vertical and horizontal align inside SVG/VML output produced by GraphicsJS. As part of AnyChart products, GraphicsJS has been tested on all devices and browsers – Windows PCs, Apple Macs, iPhones, iPads, and Android devices. It works everywhere, including IE 6.
Demo & Download
6. Graphart
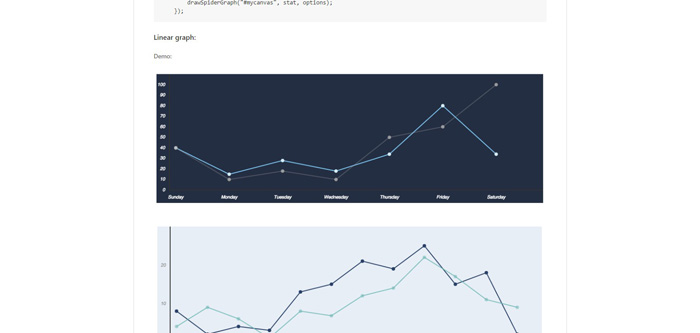
Graphart is HTML5/JavaScript charting library based on the Canvas, which allows you to create rich charts that are completely responsive and work in all browsers. Nowadays, data visualization and analysis is now a key factor of business processes. That makes it all the more important to choose the right kind of JavaScript Charting library that best matches your needs.
Demo & Download
7. MetricsGraphics.js
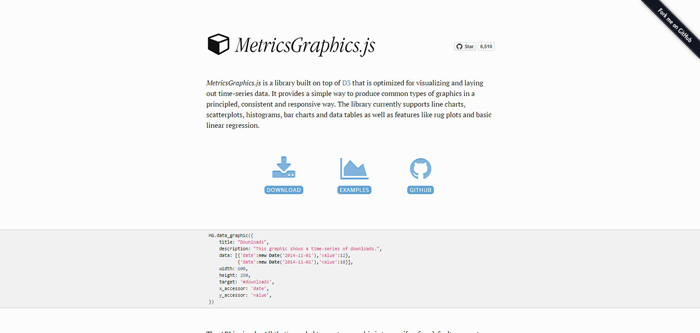
MetricsGraphics.js is a library built on top of D3 that is optimized for visualizing and laying out time-series data. It provides a simple way to produce common types of graphics in a principled, consistent and responsive way. The library currently supports line charts, scatterplots, histograms, bar charts and data tables as well as features like rug plots and basic linear regression.
Demo & Download
8. VivaGraphJS
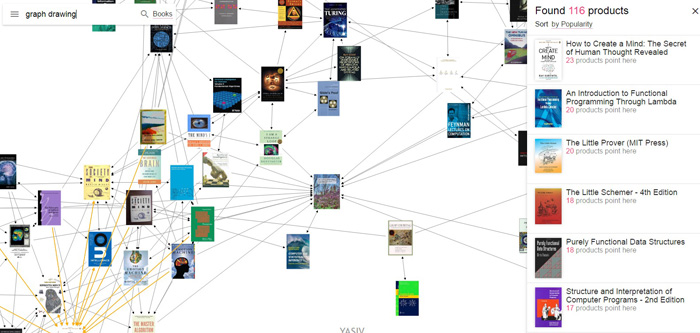
VivaGraphJS is the fastest graph drawing JavaScript library. It is designed to be extensible and to support different rendering engines and layout algorithms.
Demo & Download
9. Fancygrid
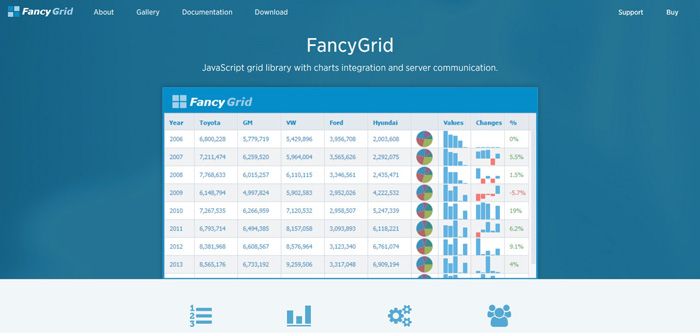
FancyGrid is JavaScript grid library with charts integration and server communication. Massive number of features: Paging, Sorting, Ajax data, Files data, REST communication with server, Integration (data binding) with charts, yheming, Touch Support, AngularJS directive and more.
Demo & Download
10. Circles
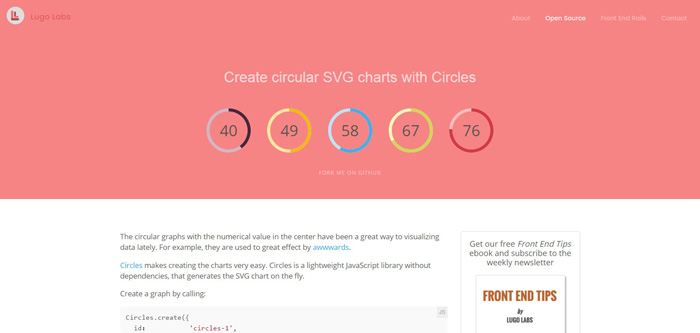
Circles makes creating the charts very easy. Circles is a lightweight JavaScript library without dependencies, that generates the SVG chart on the fly.
Demo & Download
11. Plotly.js
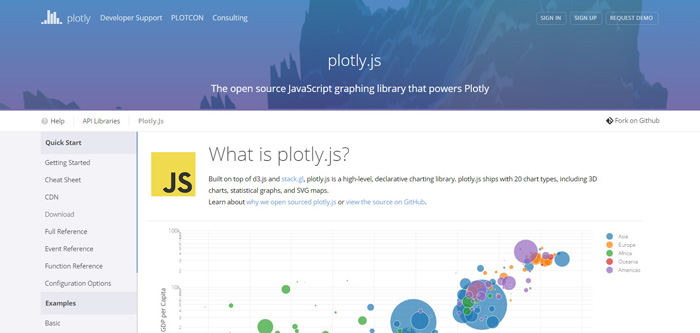
plotly.js is an open source, high-level, declarative JavaScript graphing / charting library. plotly.js ships with 20 chart types, including 3D charts, statistical graphs, and SVG maps.
Demo & Download
12. Pizza Pie Charts
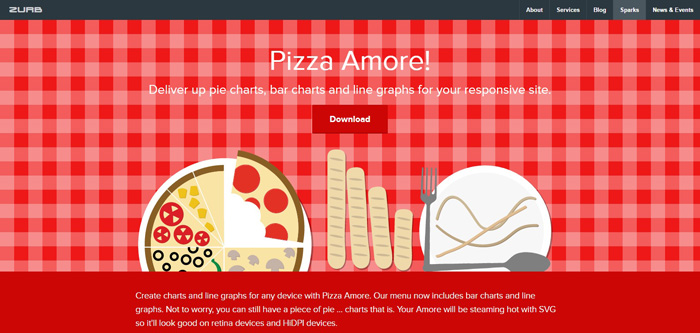
Pizza is a responsive pie, donut, bar, and line graph charting library based on the Snap SVG framework from Adobe. It focuses on easy integration via HTML markup and CSS instead of JavaScript objects, although you can pass JavaScript objects to Pizza as well.
Demo & Download
13. Cytoscape.js
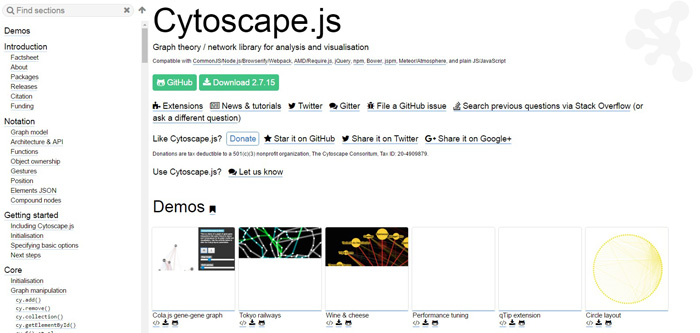
Cytoscape.js is a graph theory library for analysis and visualisation. It’s compatible with CommonJS/Node.js, AMD/Require.js, jQuery, npm, Bower, spm, jspm, Meteor/Atmosphere, and plain JS/JavaScript.
Demo & Download
14. WebCola
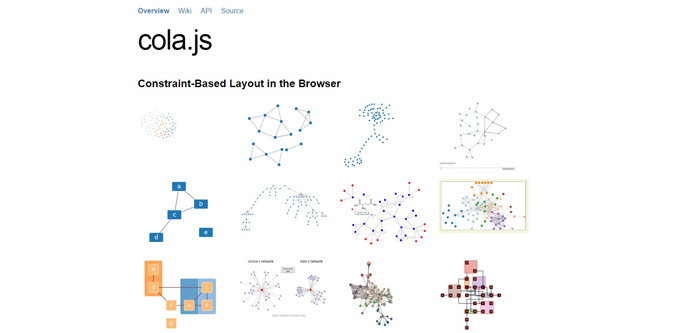
WebCola is an open-source JavaScript library for arranging your HTML5 documents and diagrams using constraint-based optimization techniques. It works well with libraries like D3.js and svg.js.
Demo & Download
15. Weather Map
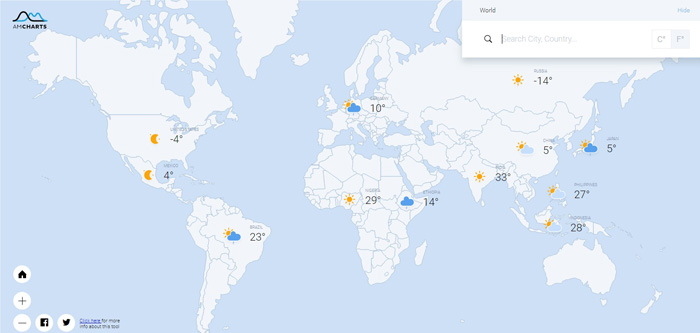
Weather Map is a JavaScript library that helps your create beautiful, dynamically-updated, searchable maps and charts with all kinds of weather-related information.
Demo & Download
16. Chartlist.js
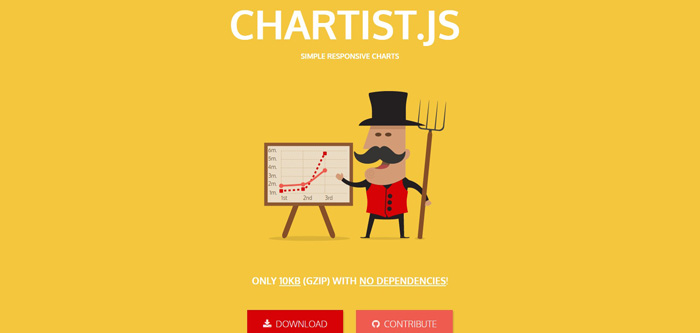
Chartist.js is a simple responsive charting library built with SVG. hartist works with inline-SVG and therefore leverages the power of the DOM to provide parts of its functionality. This also means that Chartist is not providing it’s own event handling, labels, behaviors and anything else that can just be done with plain HTML, JavaScript and CSS.
Demo & Download
17. Raphael.js
Raphaël is a small JavaScript library that should simplify your work with vector graphics on the web. If you want to create your own specific chart or image crop and rotate widget, for example, you can achieve it simply and easily with this library.
Demo & Download
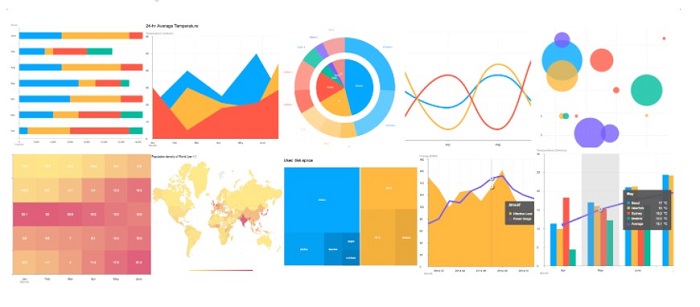
18. ZingChart
ZingChart is a powerful library providing users with the ability to quickly create beautiful charts, dashboards, and infographics. Includes hundreds of chart types with nearly limitless chart design and customization options.
Demo & Download
19. Chart.js
Chart.js is an easy, object oriented client side graphs for designers and developers. You can visualise your data in 6 different ways. Chart.js uses the HTML5 canvas element. It supports all modern browsers, and polyfills provide support for IE7/8. Chart.js is dependency free, lightweight (4.5k when minified and gzipped) and offers loads of customization options.
Demo & Download
20. FusionCharts
FusionCharts Suite XT is a lightweight, pure JavaScript charting library that allows users to create beautiful, interactive JavaScript charts. FusionCharts uses SVG and provide various type of charts including line, area, column, bar, gantt, funnel, waterfall and maps etc. When building something complicated, besides the features, the support becomes important too.
Demo & Download
21. Infographic Charts & Graphics HTML Tags Library
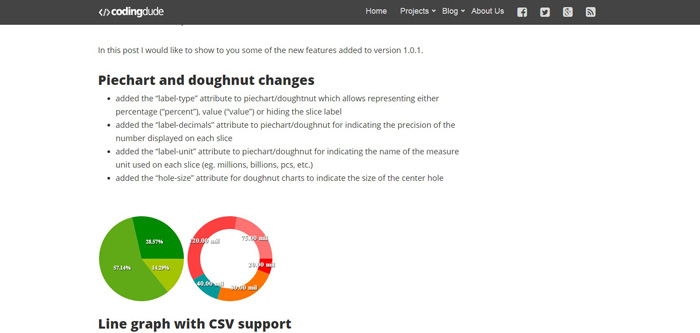
This custom JS charting library created by PSDDude from 0 implements custom HTML tags which allow creating charts and graphs for infographics.
It is a light-weight, pure JavaScript charting library (NO jQuery or other libraries required) which makes use of HTML5 technologies and works on all modern browsers including IE, Chrome, Firefox, Opera, Safari.
The library allows creating: – Piecharts and doughnuts – Shape graphs – you can transform any image(PNG) into a graph – Shape bar graphs – use any image (PNG) to construct a bar chart – Line graphs – Barchart graphs
Demo & Download
22. G2 – Intractive Data Driven Chart Library
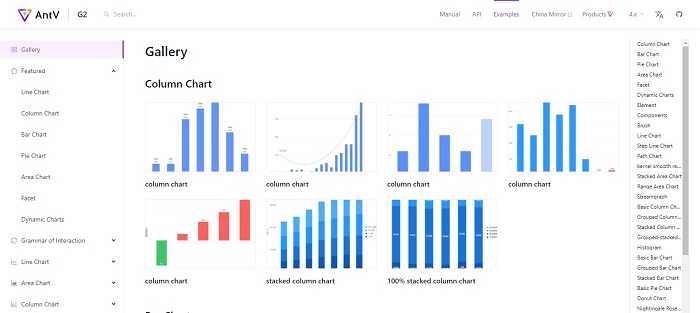
G2 is a highly interactive data-driven visualization grammar for statistical charts. with a high level of usability and scalability. You can describe the visual appearance and interactive behavior of a visualization just by one statement, and generate web-based views using Canvas or SVG.
Demo & Download
23. Vue.js
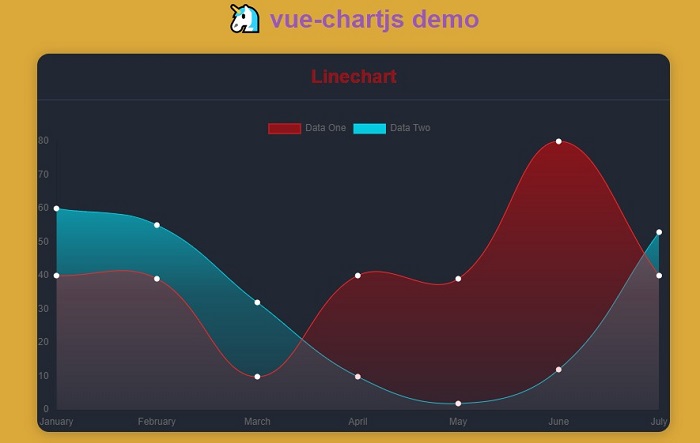
vue-chartjs is a wrapper for Chart.js in Vue. You can easily create reuseable chart components. It’s useful for people who need simple charts up and running as fast as possible. You can create bar charts, line charts, pie, radar, bubble, scatter and many more.
Demo & Download
24. F2 – Elegant, Interactive Charting Library
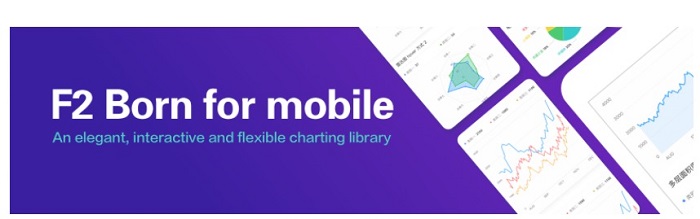
F2 is an elegant, interactive and flexible charting library for mobile. F2 is born for mobile, developed for developers as well as designers. It is Html5 Canvas-based, and is also compatible with Node.js, Weex and React Native.
Demo & Download
25. Recharts
Recharts is a redefined chart library built with React and D3. Recharts makes it easy to integrate charts into your React application. Recharts simply deploys with React components, native SVG support, lightweight depending only on some D3 submodules and declarative components, components of charts are purely presentational.
Demo & Download
26. Zeu.js
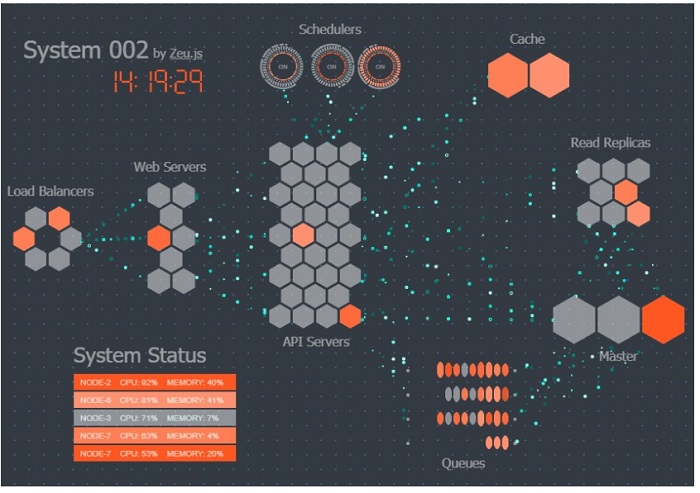
Zeu.js is JavaScript library featuring a collection of prebuilt visualization components for building real-time TV dashboard, monitoring UI and IoT web interface.
Demo & Download
27. Apexcharts.js
Apexcharts.js is a modern JavaScript charting library to build interactive charts and visualizations with simple API. It includes annotations, mixed charts, sparklines, gauges, dynamic data updation and much more.
Demo & Download
28. Gio.js

Gio.js is an open source library for web 3D globe data visualization built with Three.js. Gio.js is simple to use to customize a 3D data visualization model in a declarative way, add your own data, and integrate it into your own modern web application. You can create a 3D global data visualization model with your own data in just four lines of javascript code. You can build a responsible, fully interactive, rich 3D frontend application using Gio.js
Demo & Download
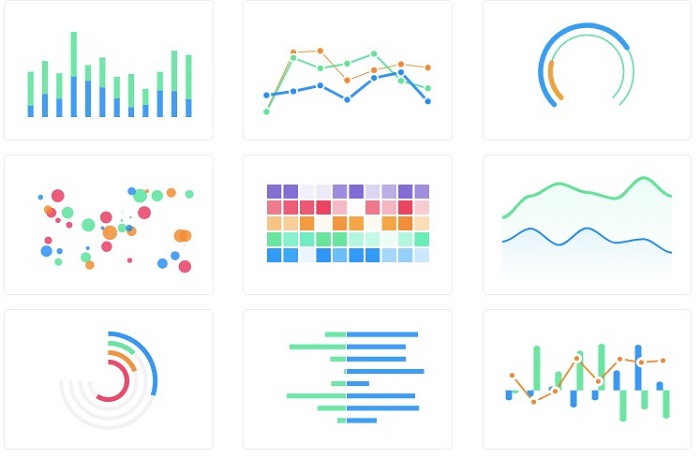
29. Toast UI Chart
TOAST UI Chart is an open source JavaScript library to draw various and essential charts on your web service. TOAST UI Chart provides many kind of charts as: Bar, Column, Line, Area, Pie, Bubble, Scatter, Map, Heatmap, Treemap, Radial, and Boxplot.
Demo & Download
30. BriteCharts
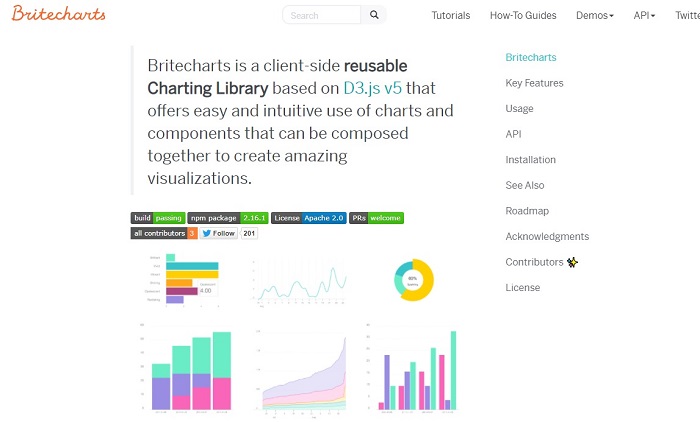
Britecharts is a client-side reusable Charting Library based on D3.js v4 that allows easy and intuitive use of charts and components that can be composed together creating amazing visualizations. With BriteCharts you can create barcharts, tooltip charts, pie charts, line charts, donut charts, mini tooltip charts, step charts, legend charts and much more.
Demo & Download


