
Charts are used to visualise data so we can understand the given information and project. In this article we have gathered a list of JavaScript libraries for creating circular charts for your projects. These libraries are responsive and allow you to create various types of charts like pie, circular, donut, bar, line, and much more. Some of these libraries are capable of displaying real time data to the users. Let us see these JavaScript chart libraries one by one.
1. Billboard.js
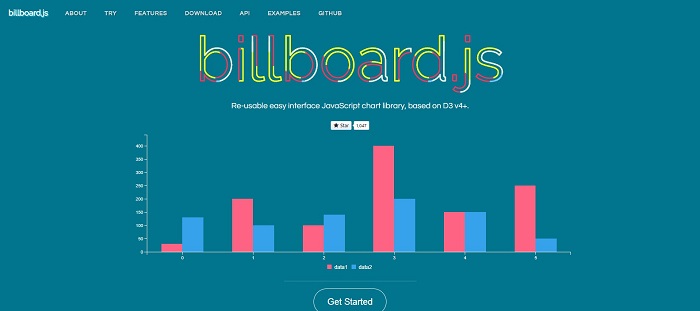
billboard.js is a re-usable easy interface JavaScript chart library, based on D3 v4+. Billboard.js allows you to create several type of charts like circular chart, gauge chart, pie chart, donut chart, line chart, bar chart and many others.
billboard.js is forked project of the popular C3.js. You can migrate with the minimal change of your code, taking all the advantages which billboard.js brings. Billboard.js works on D3 v4+.
Demo & Download
2. Britecharts
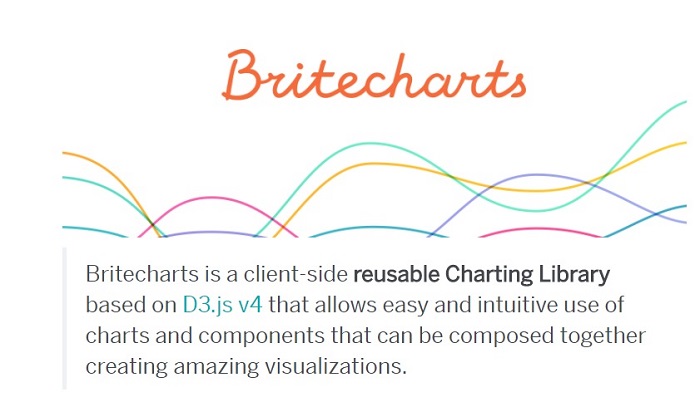
Britecharts is a client-side reusable charting Library based on D3.js v4 that allows easy and intuitive use of charts and components that can be composed together creating amazing visualizations. This library allows you to create bar chart, line chart, donut chart, brush chart, sparkline chart, tooltip chart and many others.
Demo & Download
3. Plotly.js
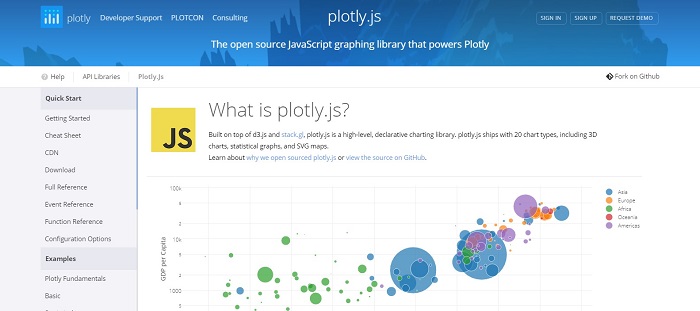
plotly.js is an open source, high-level, declarative JavaScript graphing / charting library. plotly.js ships with 20 chart types, including 3D charts, statistical graphs, and SVG maps.
Demo & Download
4. Cake Chart
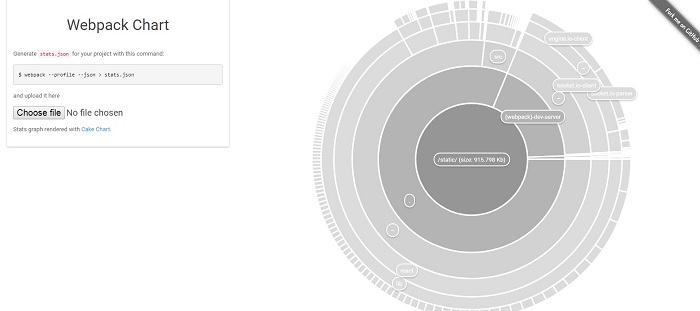
Cake Chart is a javascript library to create interactive multi-layer pie charts. CakeChart is a quite dumb component that renders provided tree, but doesn’t navigate through it, so you have to implement that part yourself. Which is not hard though.
Demo & Download
5. Circles
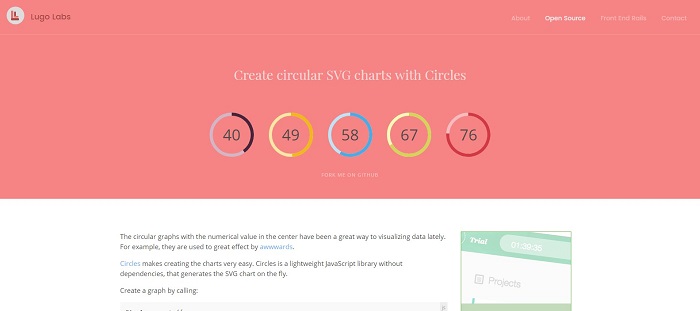
Circles is a lightweight JavaScript library without dependencies, that generates the SVG chart on the fly.
Demo & Download
6. Recharts
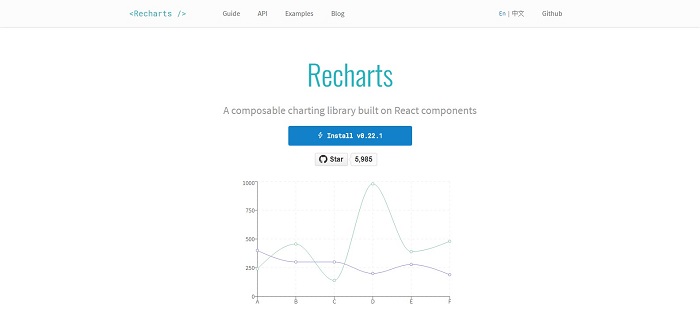
Recharts is a Redefined chart library built with React and D3. The main purpose of this library is to help you to write charts in React applications without any pain. The library also offers a rich examples catalog with more than 50 ready-to-use components, including various Line, Bar, Pie and other types of charts.
Demo & Download
7. Pizza
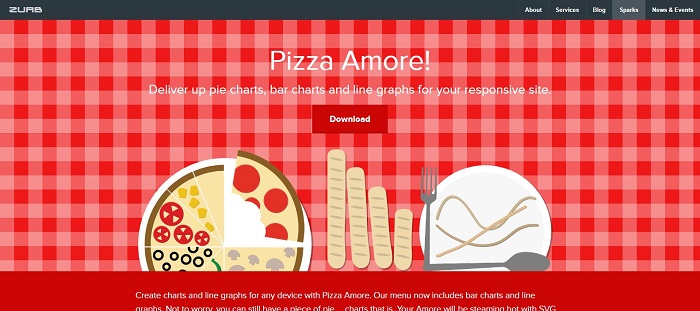
Pizza is a responsive pie, donut, bar, and line graph charting library based on the Snap SVG framework from Adobe. It focuses on easy integration via HTML markup and CSS instead of JavaScript objects, although you can pass JavaScript objects to Pizza as well.
Demo & Download
8. CircleDonutChart
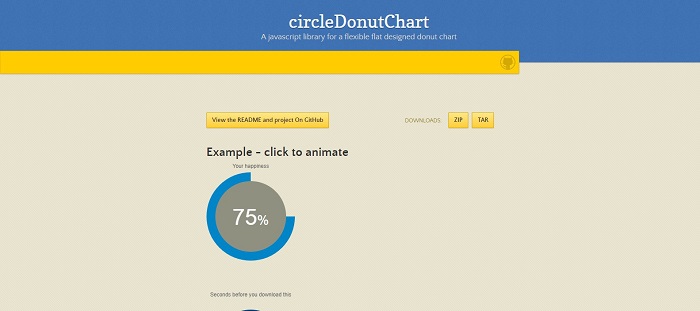
This library takes your parameters and displays a circle donut (in flat style). The displaying is performed by writing an SVG graphic into a provided DIV element. Changing values of the circle leads to a smooth animation, that can also be triggered if the scrolling position is fully showing the circle.
Demo & Download
9. Epoch
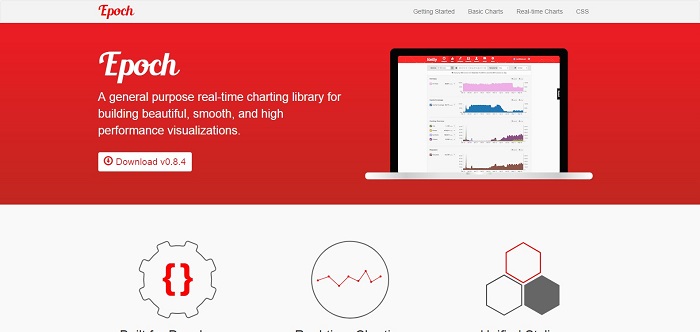
Epoch is a general purpose charting library for application developers and visualization designers. It focuses on two different aspects of visualization programming: basic charts for creating historical reports, and real-time charts for displaying frequently updating timeseries data. Epoch allows you to create pie, line, real time heatmap bar and scatter type of charts.
Demo & Download
10. Infographic Charts and Graphics HTML Tags Library
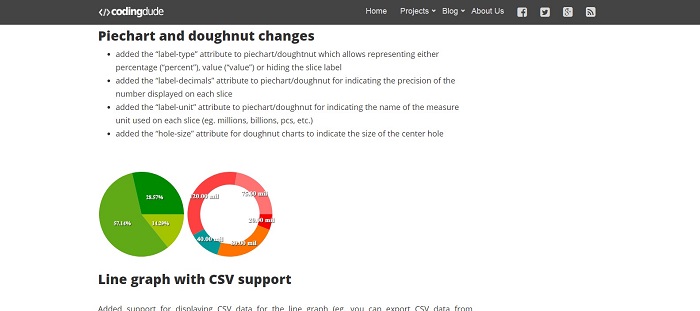
This custom JS charting library created by PSDDude from 0 implements custom HTML tags which allow creating charts and graphs for infographics.
It is a light-weight, pure JavaScript charting library (NO jQuery or other libraries required) which makes use of HTML5 technologies and works on all modern browsers including IE, Chrome, Firefox, Opera, Safari.
The library allows creating: – Piecharts and doughnuts – Shape graphs – you can transform any image(PNG) into a graph – Shape bar graphs – use any image (PNG) to construct a bar chart – Line graphs – Barchart graphs.
Demo & Download
11. Grafikon
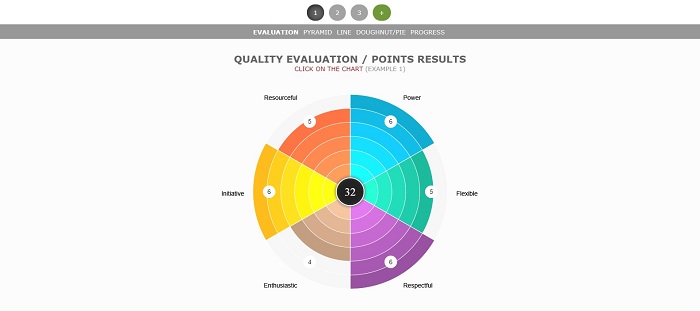
Grafikon is a JQuery Chart Plugin, that gives you the possibility to create your own unique chart with full customization. At present, there are six main modes: evaluation, pyramid, line, pie, doughnut and progress. Grafikon is easy to use and it is fully customizable – colors, sections, levels, fonts settings and many more. Also, Grafikon has a responsive option. Last but not least you can export your graphs as images. This way you can save current results and use them in presentations and not solely in web.
Demo & Download
12. DoChart
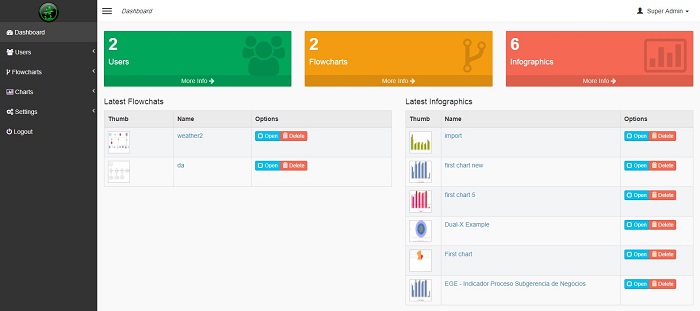
Creating beautiful infographics and flowcharts are very easy with Do Chart. Infographics make complex information eye catching, shareable and easily digestible. Most importantly, they play a crucial role in the increasingly visual world of marketing.
With Do Chart, you can create FLOWCHARTS and 7 different types of infographic charts including very common Bar chart, Pie chart, Line chart etc.
Demo & Download


