
With jQuery chart and graph plugins you can create interactive charts and can visualize your data to understand the things better. Following jQuery chart and graph plugins are lightweight, easy to integrate and packed with some nifty features. With these jQuery chart and graph plugins you can create different types of charts like cicrular charts, pie chart, line chart, bin chart, bar charts, bubbles and much more. Let’s explore these Top 16 jQuery Chart and Graph plugins below.
1. Chartli
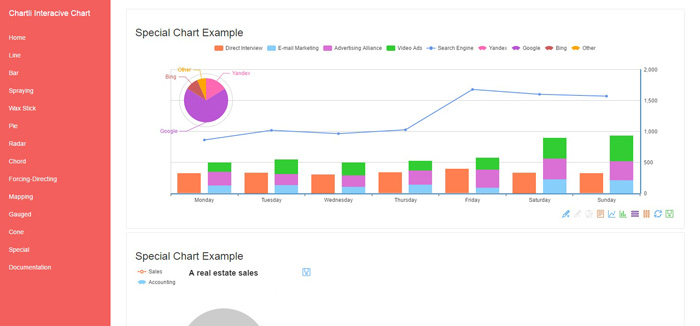
Chartli is a jQuery plugin which allows you to create interactive charts easily. This plugin includes several handy features like interactive chart elements, change color easily, change chart type, save as PNG images all charts and includes detail documentation for easy use.
Demo & Download
2. GraphUp
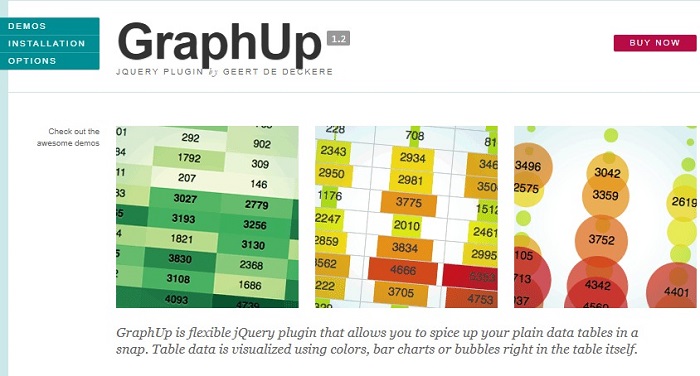
GraphUp is a very flexible and lightweight jQuery (v1.8+) plugin to spice up your data tables. It visualizes the values using color, bar charts and bubbles. GraphUp is lightweight, and creates your own cleaners, painters or color maps. Also, a callback is available to perform any operations on a cell before painting. Super flexible, endless possibilities!
Demo & Download
3. Infographic Charts & Graphics HTML Tags Library
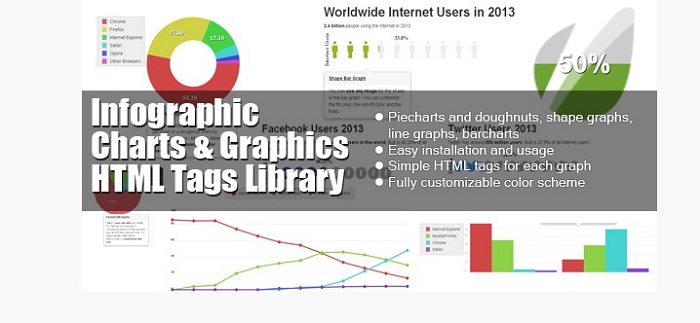
This custom JS charting library created by PSDDude from 0 implements custom HTML tags which allow creating charts and graphs for infographics.
It is a light-weight, pure JavaScript charting library (NO jQuery or other libraries required) which makes use of HTML5 technologies and works on all modern browsers including IE, Chrome, Firefox, Opera, Safari.
The library allows creating: – Piecharts and doughnuts – Shape graphs – you can transform any image(PNG) into a graph – Shape bar graphs – use any image (PNG) to construct a bar chart – Line graphs – Barchart graphs and much more.
Demo & Download
4. G2 – Intractive Data Driven Chart Library
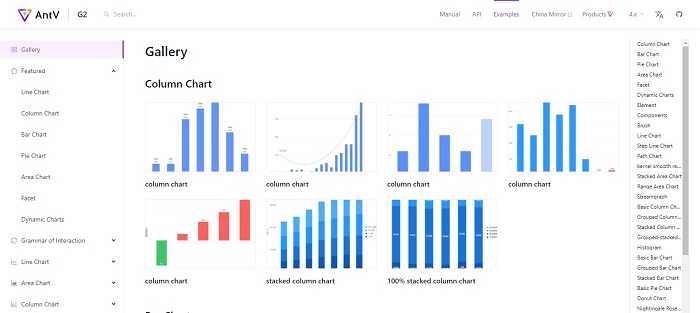
G2 is a highly interactive data-driven visualization grammar for statistical charts. with a high level of usability and scalability. You can describe the visual appearance and interactive behavior of a visualization just by one statement, and generate web-based views using Canvas or SVG.
Demo & Download
5. Vue.js
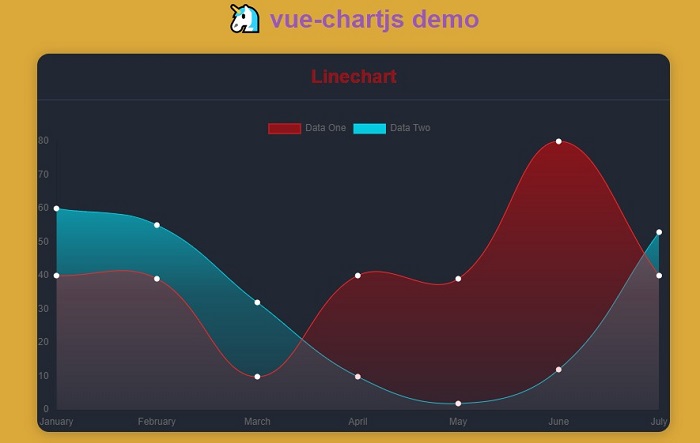
vue-chartjs is a wrapper for Chart.js in Vue. You can easily create reuseable chart components. It’s useful for people who need simple charts up and running as fast as possible. You can create bar charts, line charts, pie, radar, bubble, scatter and many more.
Demo & Download
6. Grafikon
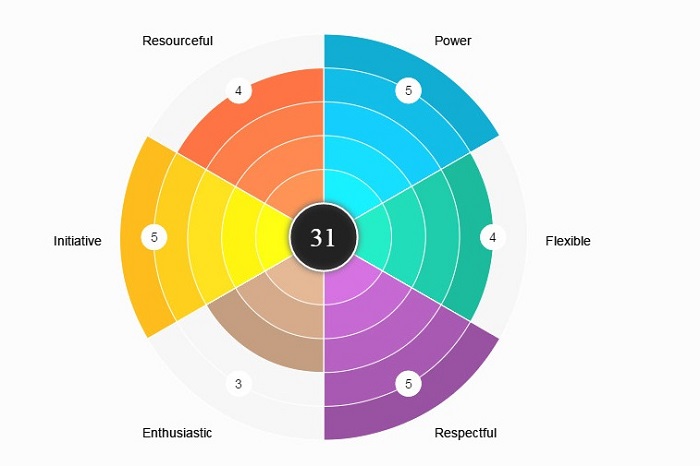
Grafikon is a jQuery chart plugin, that gives you the possibility to create your own unique chart with full customization. At present, there are six main modes: evaluation, pyramid, line, pie, doughnut and progress. Grafikon is easy to use and it is fully customizable – colors, sections, levels, fonts settings and many more.
Also, Grafikon has a responsive option. Last but not least you can export your graphs as images. This way you can save current results and use them in presentations and not solely in web.
Demo & Download
7. DoCharts
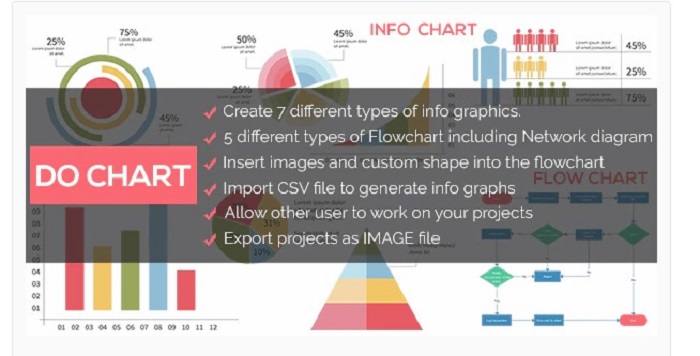
DoCharts allows you to crate infograhpics and flow charts easily. With DoCharts you can create flow charts and 7 different types of infographic charts including bar chart, pie chart, line chart and much more.
Demo & Download
8. F2 – Elegant, Interactive Charting Library
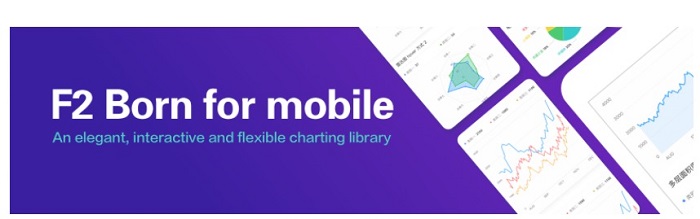
F2 is an elegant, interactive and flexible charting library for mobile. F2 is born for mobile, developed for developers as well as designers. It is Html5 Canvas-based, and is also compatible with Node.js, Weex and React Native.
Demo & Download
9. G6 – Graph Visualization Framework
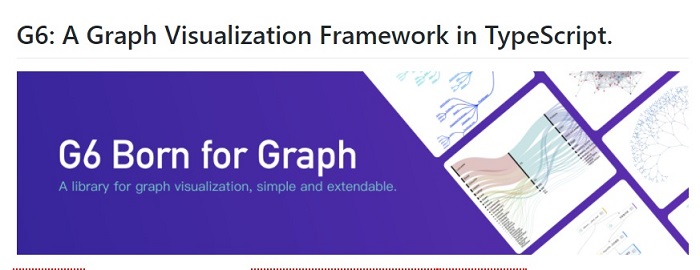
G6 is a graph visualization framework. It provides a set of base mechanisms, help developers to build your own graph visualization analysis application or graph visualization edit application.
Demo & Download
10. jQuery gantt
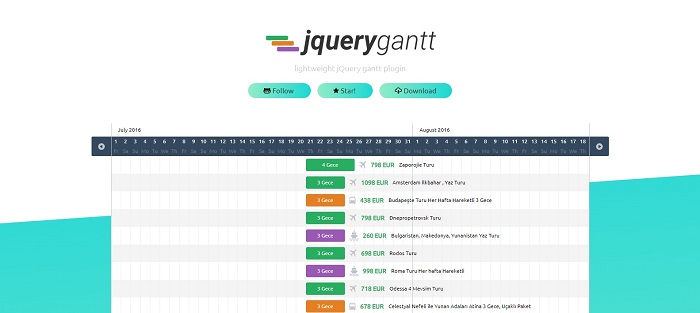
jQuery-gantt is a lightweight jQuery plugin for creating a gantt chart. It is lightweight, localizationable, browser compatible and easy to setup.
Demo & Download
11. jQuery.ganttView
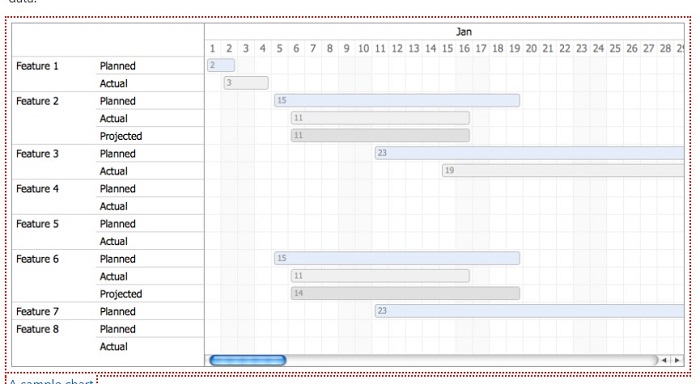
The jQuery.ganttView plugin is a very lightweight plugin for creating a Gantt chart in plain HTML. No vector graphics or images required. The plugin supports dragging and resizing the Gantt blocks and callbacks to trap the updated data.
Demo & Download
12. Pro Chart
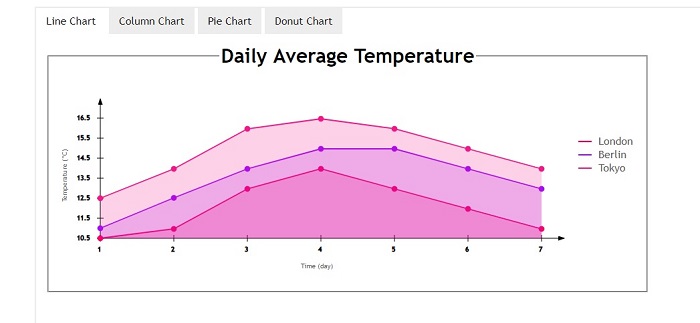
Pro Chart is a jQuery chart plugin which easily creates interactive Curved or Straight Linear/Scatter, Area, Pie, Doughnut (Donut) and Column charts for your web projects. The plugin allows to get required coordinates for drawing charts both from a given array and from HTML table. Using such additional parameters as chart type, line thickness, line color, text color, font, etc., in call of the Plugin you can change the appearance and type of the graphic.
Demo & Download
13. FlyCharts
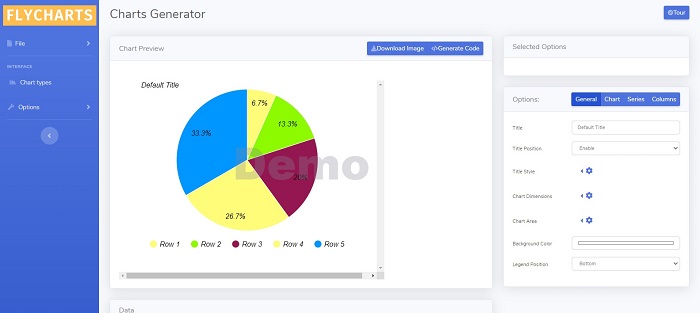
FlyCharts is a standalone application which you can use to generate embed charts for your website. It is compatible with many CMS’s where you can paste html code into the content.
FlyCharts allows you to create different types of charts like Pie chart, Line chart, Bin chart and others. You can easily configure them to get the results you need. You may create as many charts as you want. The final result can be downloaded directly as image or you can use javascript embed code to show the chart.
Demo & Download
14. FootCharts
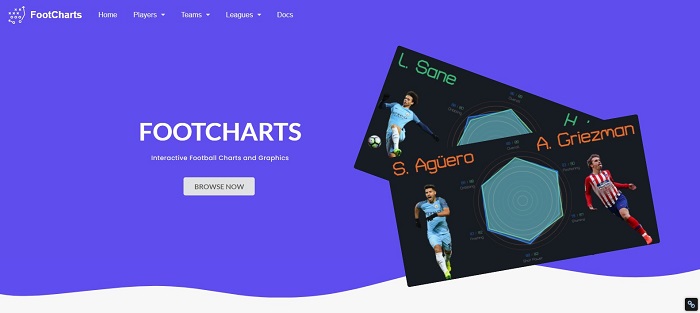
This plugin allow create interactive charts and statistic graphs. You can change data and customize your own graphics. Datas is not real and many data was created manually.
Demo & Download
15. X4 Crypto Charts
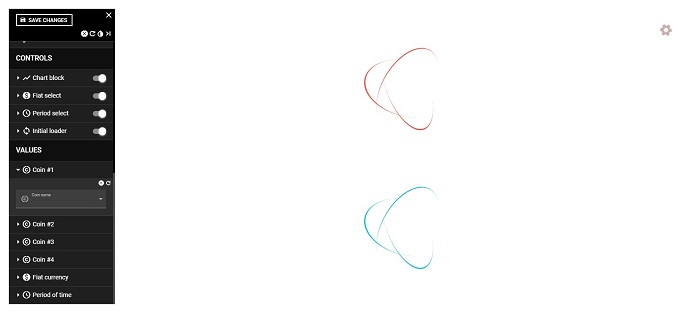
X4 Crypto Charts plugin retrieves cryptocurrency coin price using CoinCap.io API and then displays that data on the charts using Chart.js library.
It comes with Visual Customizer with tons of settings allow you to change every pixel in the charts including chart type, chart height, set of coins, fiat currency, time period, coin property, chart background, chart thickness, chart smoothness, chart colors, crosshair, watermark, tooltip, legend, scales, grid etc.
Demo & Download
16. ProgressPieSVG
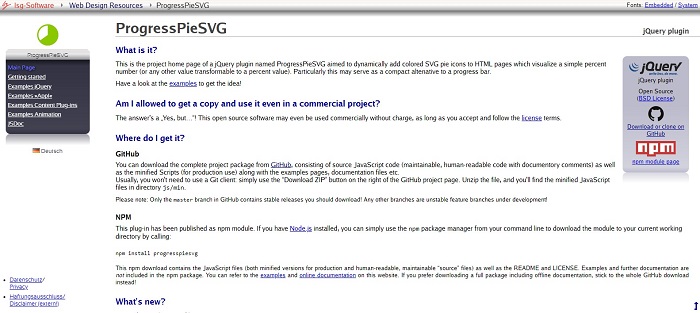
ProgressPieSVG is a jQuery Plugin for dynamically adding circular progress bars (rings) or pies to percent values in a website (visible or invisible). ProgressPieSVG is highly customizable and extensible.
Demo & Download


